
Gains Gurus
Digital platform for a data-driven investment strategy company.
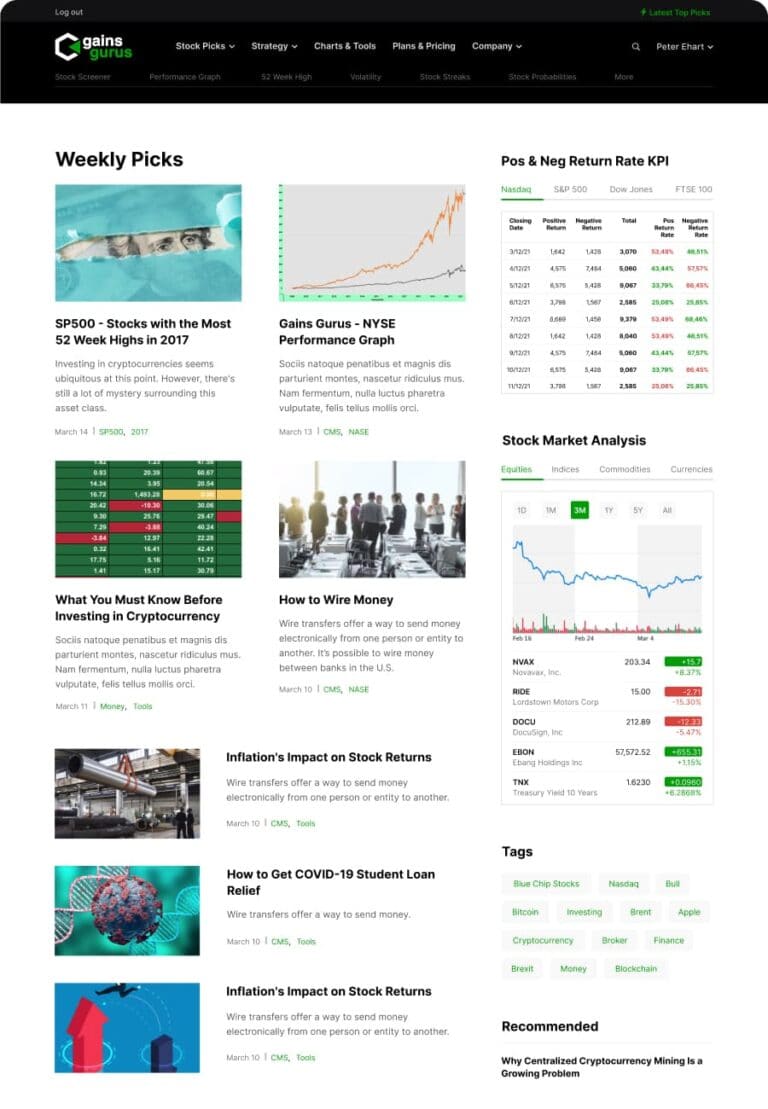


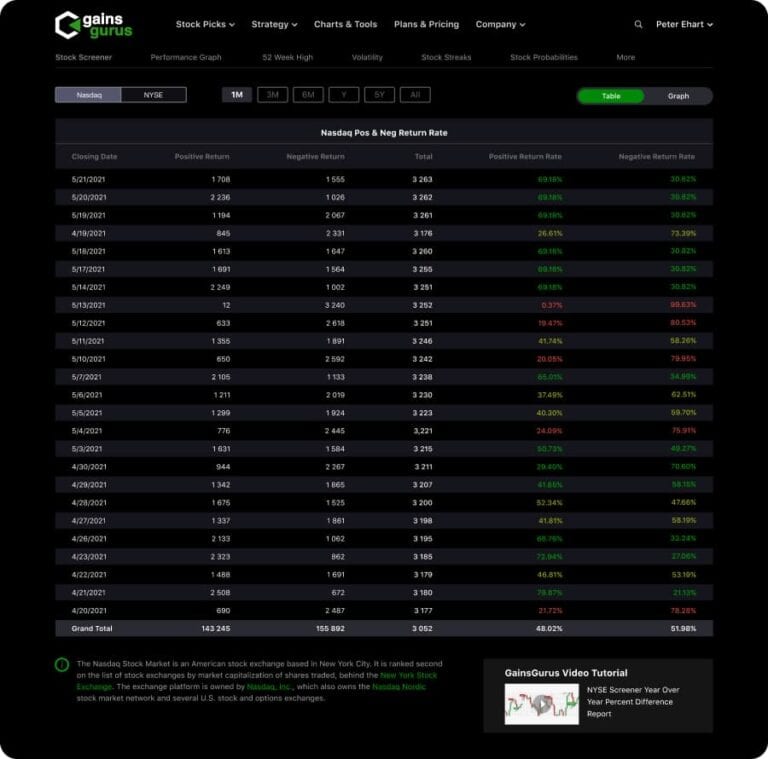



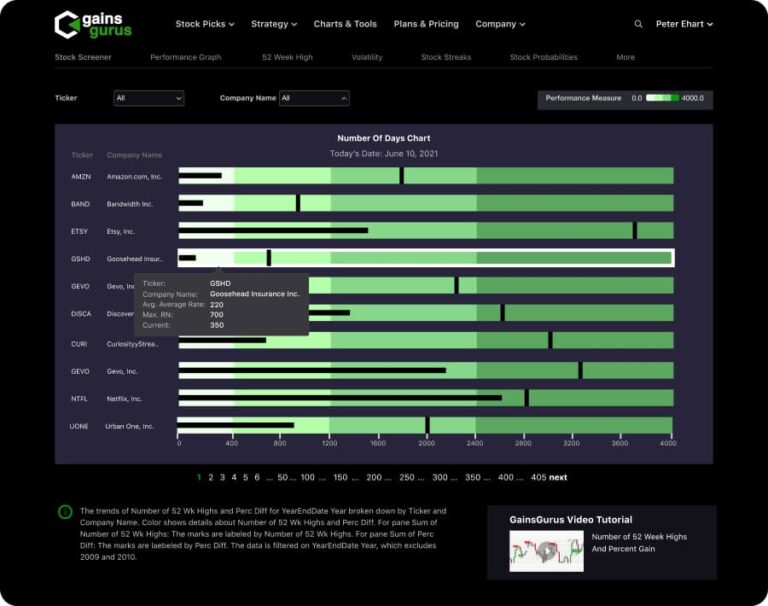

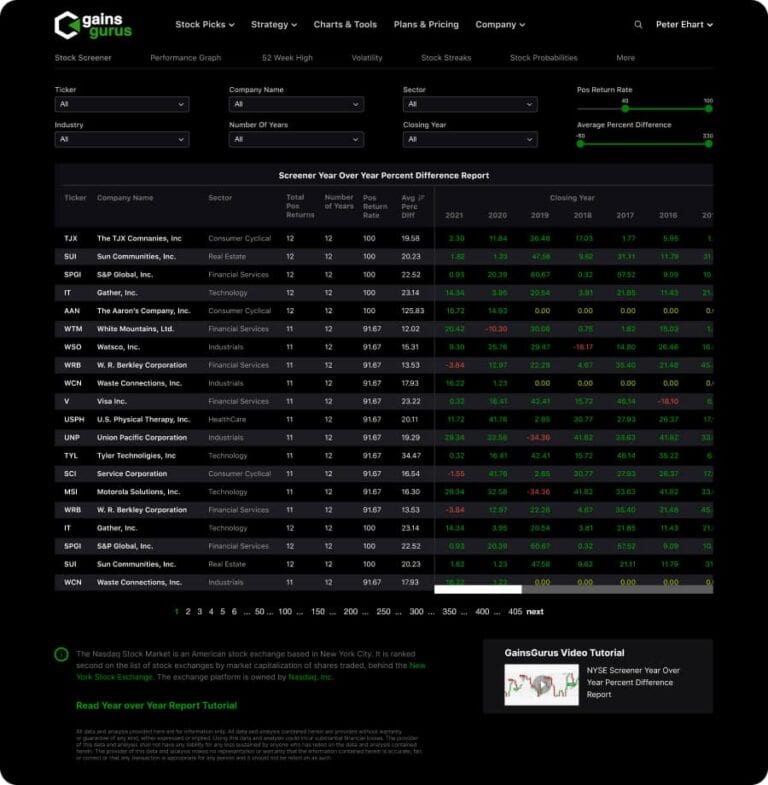


Harnessing algorithms and interactive models for enhanced stock analysis.
Gains Gurus developed algorithms to extract and process financial data, while Dizzain developed a set of interactive models that enable users to analyze key financial indicators for stocks such as the number of 52 Week Highs, Volatility, distance from a 52-week high, streaks, and performance spread indicators.


From Concept to Creation: Charting the Journey of UX+UI design.
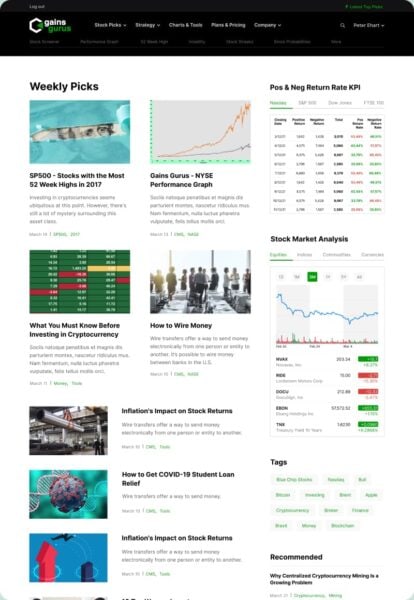
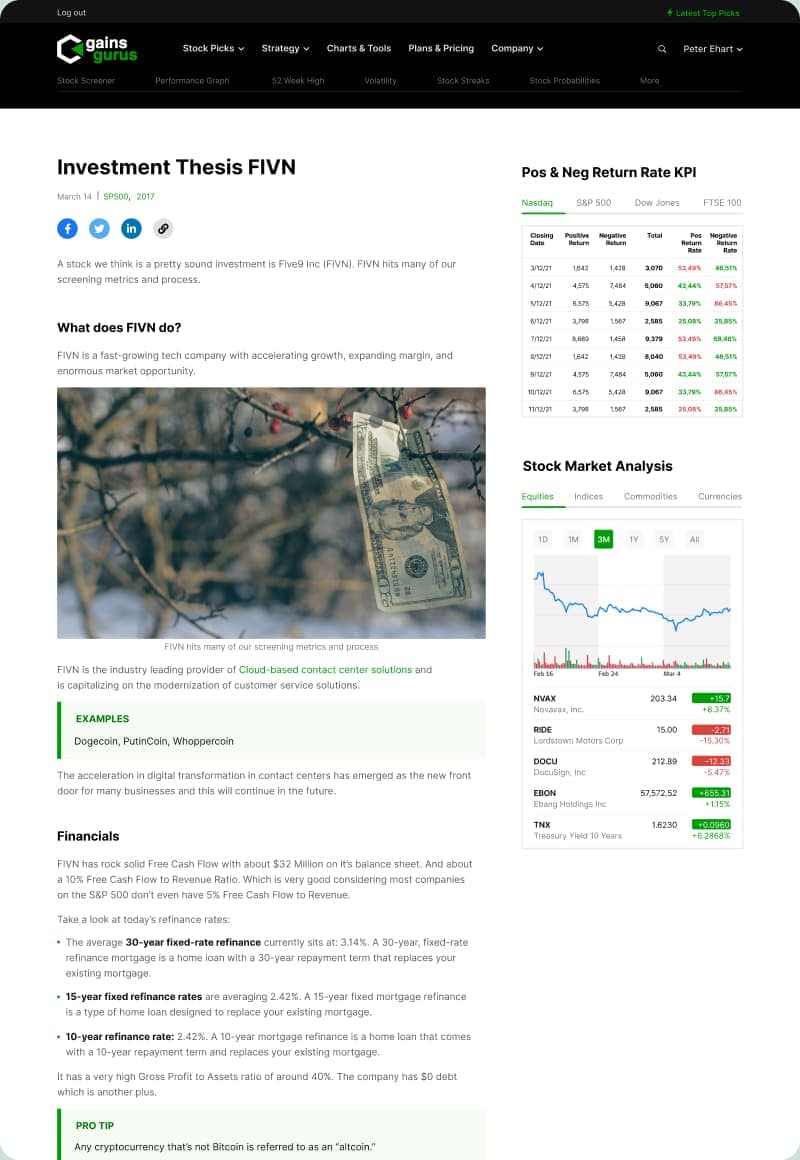
Stocks can be analyzed based on Year over Year, Month over Month, and Quarter over Quarter Returns. Data visualizations are custom-built using React and Chart.js, with near-instantaneous load, which was paramount for the optimal user experience.
We used WooCommerce to power the subscription functionality – subscriptions enable access to premium models and content.






Summary
Gains Gurus partnered with Dizzain to develop interactive tools for analyzing crucial financial metrics.
These tools are enhanced by custom data visualizations crafted with React and Chart.js, and they provide premium content accessible through subscriptions.
Dizzain had created a finished product. I’m 100% satisfied.
Initial feedback from testers has been positive, citing the comprehensive features on the site. Dizzain was adaptable in their meeting schedule and prioritized innovation. Clients can expect a partner that understands budgetary constraints. They are a straightforward, trustworthy partner.
Kyle Antonaitis,
Co-Founder, GainsGurus