Why Conversion Delay Can Mislead Your Campaign Reports
Author
Ilya Sinkevich
PPC Growth Lead
From seasonal surges to year-round scale, I help brands turn fragmented ad performance into cohesive growth — delivering seven-figure revenue annually.
Most marketers trust what they see in their Google Ads reports. But what if the data is only telling part of the story? Beneath the surface of clicks, CPA, and ROAS lies a hidden variable that can distort your decisions: conversion delay.
In this article, we explore how to surface the accurate performance of your campaigns using a forecasting method that’s easily accessible within Google Ads — and why ignoring it can lead to costly mistakes.
Key Takeaways
- Conversion delays can skew CPA and ROAS, making campaigns look less profitable than they truly are.
- Google Ads includes forecasted conversions, but many advertisers overlook them.
- Google’s projected performance outcomes are surprisingly accurate, often within 1–5% of the final result.
- Weekly reports should include both actual and projected conversions to avoid misinterpreting performance.
- Ignoring conversion delay can lead to premature optimizations and budget misallocation.
Why Your Google Ads Reports Might Be Misleading
You open your Google Ads report. The numbers appear solid — clicks, impressions, conversions, CPA. And yet, something doesn’t add up. Last month’s top-performing campaign now looks flat. Budgets are under review. Your CMO wants to know: “Why is performance down?”
The answer could be conversion delay.
What is Conversion Delay
Conversion delay is the time gap between a user clicking an ad and the moment a meaningful user action is completed — whether that’s a purchase, signup, or other tracked goal. And that’s the nuance marketers often miss: Google Ads backdates the result to the original click date, not the conversion date. So, if a user buys five days after clicking, it’s recorded as if it happened on day one.
This creates a mismatch between when performance actually happens and when it’s reported — especially in weekly reports.
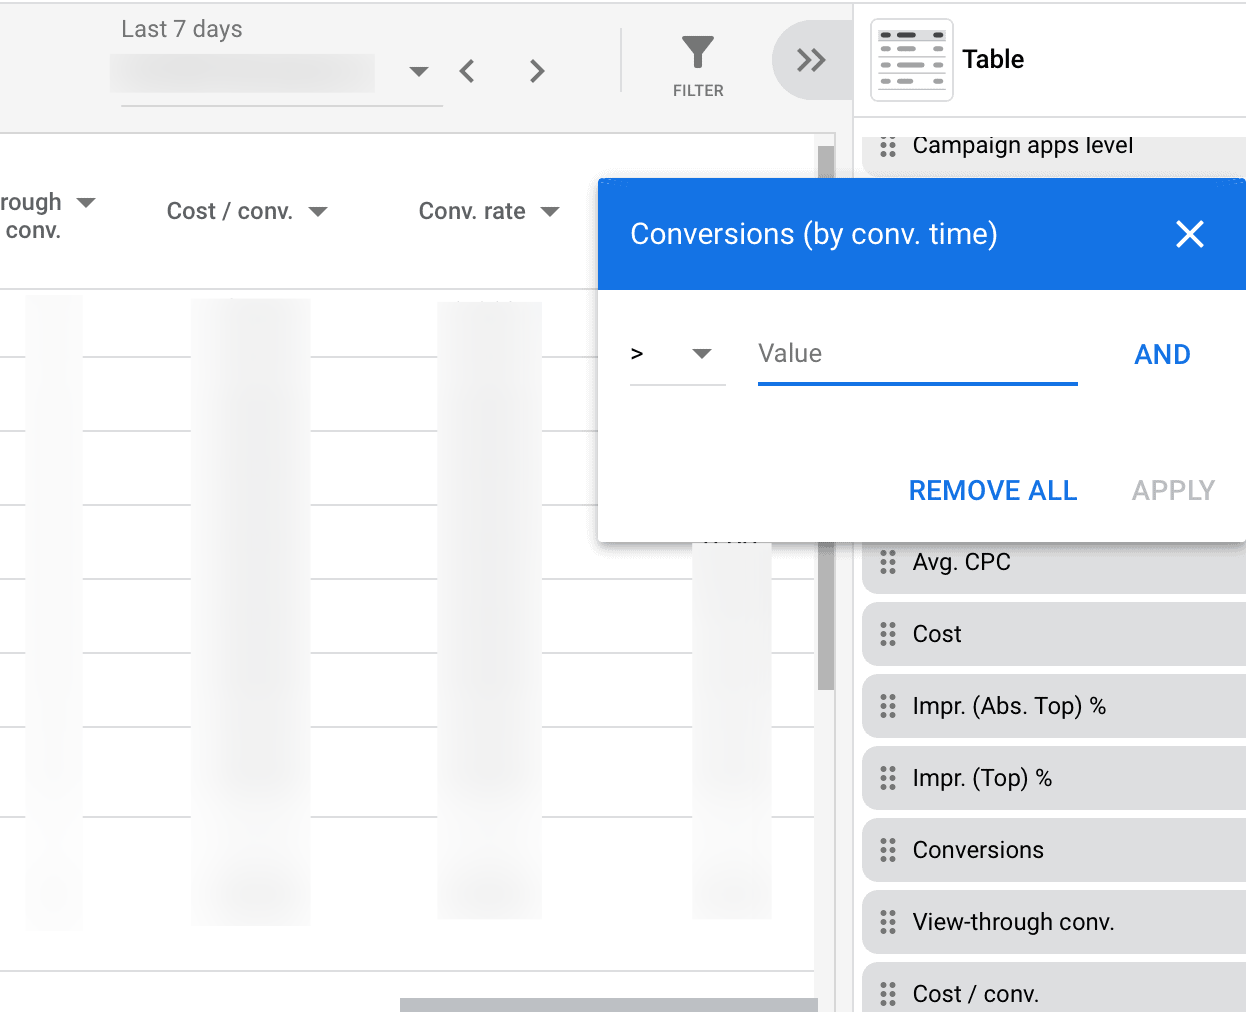
Pro tip: Use the “Conversions (by conv. time)” column to see when conversions occurred, not just when the clicks happened. It’s a game-changer for tracking daily revenue, ROAS, and CPA accurately.
Conversion Delay Factors
Industry & Decision-Making Cycle
B2C transactions are generally faster and more straightforward. However, certain high-value purchases, such as buying a house or medical services, require careful consideration, customization, and sometimes the involvement of multiple stakeholders — similar to B2B sales cycles.
Calendar Events
PPC campaigns often face seasonality, with conversion delays varying by the time of year. During peak seasons like back-to-school, national holidays, or festive periods, consumers tend to delay purchases.
- Black Friday: In the weeks before Black Friday, many consumers postpone shopping, awaiting better deals.
- Christmas: Unlike Black Friday’s single day, Christmas spans weeks. Early December clicks might not convert until closer to the holiday. Adjust your attribution window to account for this delay.
Understanding these variables empowers marketers to refine campaigns and calibrate attribution. Here’s how we do it.
Case Study: Tackling the Impact of Pricing and Seasonality in Campaigns
For a premium children’s camp network, understanding conversion delay is non-negotiable. Parents typically take their time — comparing options, weighing costs, planning around school calendars. That decision journey isn’t short.
So we set out to measure just how long that decision-making really takes:
- In winter, the average conversion delay was 44.6 days.
- By spring, as urgency grew, that dropped to 16.3 days.
These shifts dramatically affect metrics like cost-per-conversion and conversion rate. Without adjusting for delay, reports can look artificially weak — leading to incorrect decisions.
Switching to “Conversions (by conv. time)” and adjusting the attribution window to 90 days helped us spot these patterns and optimize accordingly. Still, even that view reflects only what’s been recorded so far — not what’s still coming. If you’ve paused a campaign based on incomplete data, you might have stopped a winner mid-run.
Which brings us to the bigger issue…
How Conversion Delay Distorts Campaign Performance
Depending on your attribution window — which can be set up to 90 days — conversion lag skews your reports in three critical ways:
- CPA appears higher when goal completions lag behind.
- ROAS looks deflated since revenue is undercounted.
- Campaigns are misjudged based on incomplete data.
But how should a performance marketer go about optimizing their campaigns with such a long lag in data insights?
Fortunately, Google Ads offers a built-in feature to address this.
Where Is Conversion Delay Reporting in Google Ads?
You can easily access Conversion Delay reporting through your campaign dashboard and attribution settings:
1. Open any campaign view in Google Ads.
2. Hover over the Conversions columns (Cost/Conv, Conv. Value, Conv. Rate) at the intersection with Total Conversions.
3. A small graph may appear.
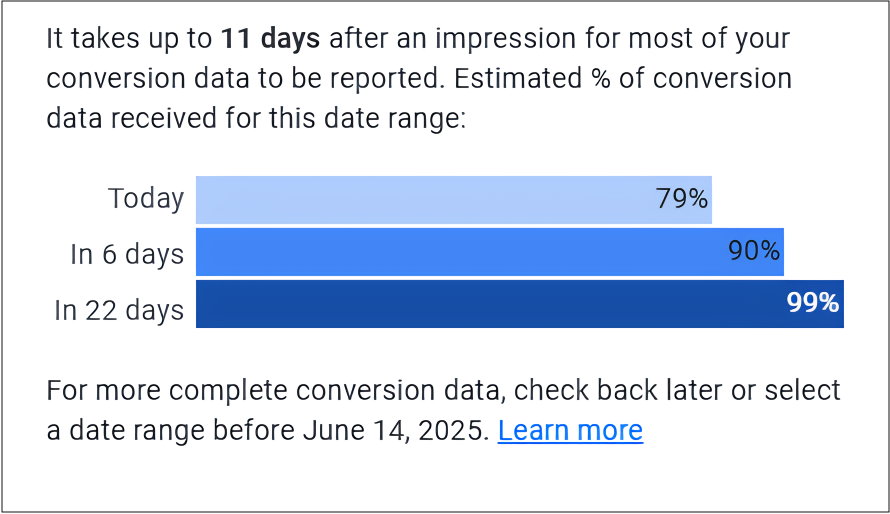
Google predicts conversion completion based on historical lag patterns — and it extends to conversion value, rate, and ROAS too. But this feature isn’t labeled clearly or found in standard downloadable reports.
Which raises a natural question…
Can We Trust the Forecast?
In short: yes. Over the past three years, we have rigorously tested this feature across 200+ campaigns for clients in the recreation sector, specifically youth sports camps. Here’s how we approached it:
- Weekly Tracking: Each week, we recorded the initial number of conversions reported by Google.
- Forecast Logging: We then logged Google’s forecast for the final conversion total for each campaign.
- Final Check: Thirty days later, we compared the forecasted figure with the actual number of conversions.
The results were consistent: Google’s forecast was almost always within 1–5% of the actual total based on our data. For example, in one campaign, Google predicted 1,746 conversions, while the actual total was 1,750 – just four conversions off. This level of precision is more than enough to support strategic decision-making.
However, we strongly recommend testing this within your own accounts, as our findings are based on our data and may vary depending on your specific campaign dynamics.
Next, let’s explore how to present this data to executives.
A Smarter Way to Report: Weekly Tables With Forecasts
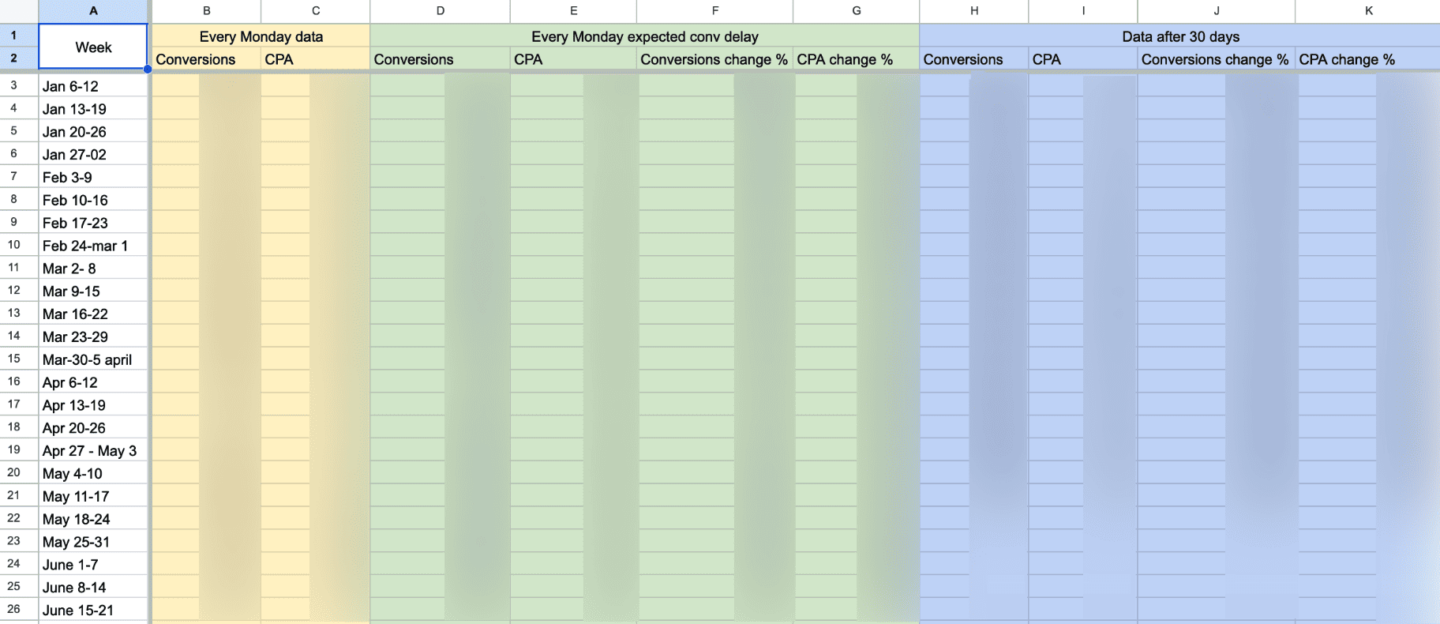
To provide clarity to stakeholders, we advise integrating forecasted data into your regular reporting. By evaluating performance from three perspectives — current results, last year’s data, and Google’s forecasts — you gain a clearer, more informed view of your campaigns.
Here’s how it looks in practice:
Notice how the forecasted conversion count improves both CPA and ROAS, bringing them in line — or even above — last year’s performance. Without that adjustment, the full picture remains hidden, leaving your campaign vulnerable to costly missteps.
Why Incomplete Conversion Data Is a Silent Risk
Let’s pause and reflect: what happens if you don’t account for conversion delay?
This is a game-changer:
- Under-reported performance, which erodes trust in marketing data.
- High-performing campaigns paused too early before they show full results.
- Misallocated budgets based on distorted CPAs and ROAS.
- Friction with finance and executive leadership.
Yet despite the impact, conversion delay still doesn’t get the attention it deserves. In our work with US Sports Camps, accurate pacing and forecasting allowed us to shift budgets mid-season without compromising ROI.
Likewise, in our research on PMax strategies, we discovered how focusing on real conversions led to more effective budget distribution and stronger returns.
Because in high-stakes environments, forecasting turns your reports into actionable insights for sharper decisions.
Final Thoughts
The biggest mistake advertisers make is treating Google Ads reports as the final say. They’re not. They’re a work in progress — a snapshot of now, not a full story of performance.
When you layer in conversion delay data, those reports transform from static scorecards into dynamic forecasting tools. You move from reacting to leading. You defend strategy with confidence.
The next time your campaign looks “down,” pause. Check the forecast. Then act.